It would be an understatement to suggest England have performed poorly in the current ODI World Cup. I have a number of views on the reasons behind this, with the quantifiable part of those views something I plan on articulating over the coming days.
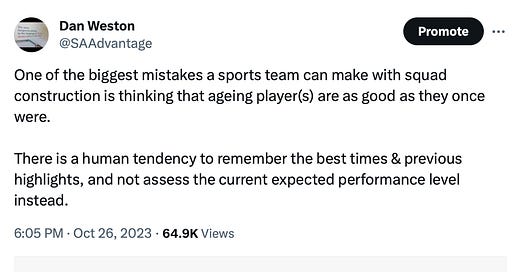
Several days ago I tweeted the following with regards to the England team:-
My view is that this is one of the biggest problems with maximizing the expected value of squad building. Emotional decision-making is a huge hurdle to overcome and most teams cannot do it particularly efficiently. Essentially, it’s easy to think of the strong performances of aging players and not current performance levels, and these players often hold considerable sway in a dressing room environment - it’s not easy to cut them. Strong coaches and administrators will be better at this, but arguably they are in the minority.
With this in mind, I thought I’d post the chapter from my e-book ‘Strategies for Success in the IPL’ which looks at the impact of age on a player’s career. It focuses on continued evaluation of players current and future expected performance levels, and not on what they may have done at their peak. Essentially, there’s a general tendency that players who perform well in their mid-30s and older have such a high peak to decline from that, say 80% of their peak, is still good enough.
While I wrote this book in lockdown in 2020, there’s still plenty of applicable content to the current game and an abundance of thought-provoking discussion. If you would like a copy, please feel free to send £25 via PayPal to daniel.weston79@yahoo.co.uk.
The Impact of Age
Some T20 leagues, such as the Pakistan Super League, have requirements for teams to pick what are described as emerging players - typically, young players with little in the way of exposure in professional, high-level cricket. However, in the Indian Premier League, there are no such requirements, and from an age perspective, teams are permitted to construct their squad in any way they so wish.
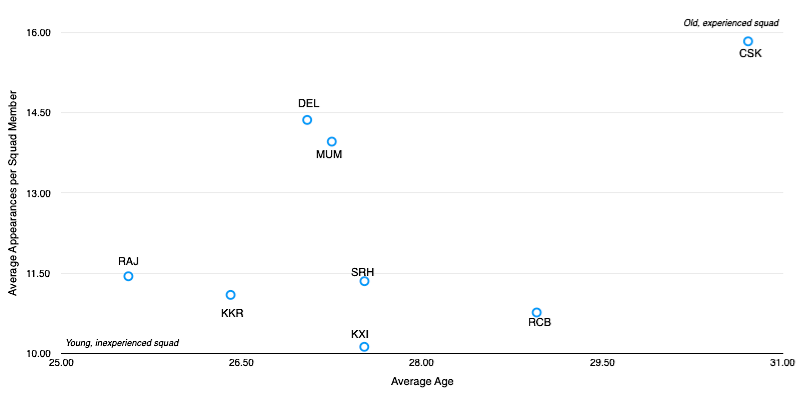
It is fascinating to see how teams have chosen to set-up their current squads. Chennai Super Kings, for example, have set up their squad with a real focus on experience (particularly Indian Premier League experience) as well as familiarity with team-mates. This can be seen by the chart below (average age of current squad compared to average appearances per squad member across the last two Indian Premier League seasons), which highlights them in the top-right hand corner - summarised by ‘old, experienced squad’:-
The varying age and experience dynamics of the various Indian Premier League squads can be seen above, with Chennai having an average age of around two years per player more than the players in the next oldest squad, Royal Challengers Bangalore. Both Rajasthan Royals and Kolkata Knight Riders are the opposite - they have young but inexperienced squads - and it will be interesting to see how these two teams improve in future years if they keep the core of their squads together.
Delhi Capitals and Mumbai Indians are grouped closely together in the chart, and their dynamics of having solid experience in conjunction with an average age which is below-
average suggests they have a playing group which is closer to the generally accepted peak age, while having decent experience. I anticipate that this will stand them in good stead for the near future.
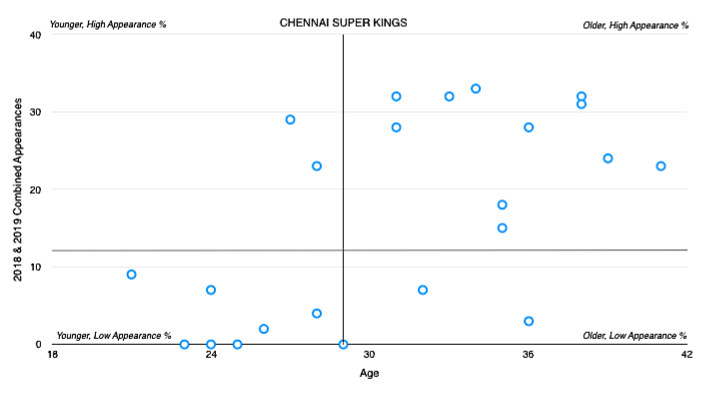
Chennai Super Kings’ approach has worked well for them across the last two seasons, since they returned to the Indian Premier League. They won the tournament in 2018, and lost the final by just one run to Mumbai Indians in 2019. However, it will be interesting to see how they approach the next auction. The chart below indicates their current age (at May 3rd, 2020) versus appearances dynamic for their current squad:-
Here we can see that there is a clear polarisation with a large grouping of players highlighted as ‘older, high appearance’ along with a number of younger players rarely having had Indian Premier League game time. In an ideal world, teams would have no players in or approaching the bottom-right hand corner (older, low appearance), given the expected decline for older players, and although Chennai Super Kings don’t have many players in this area, eventually there will be a stage where their older players will need to be replaced. Whether they do this gradually, or via a complete overhaul in a subsequent auction, will be interesting to assess in the future.
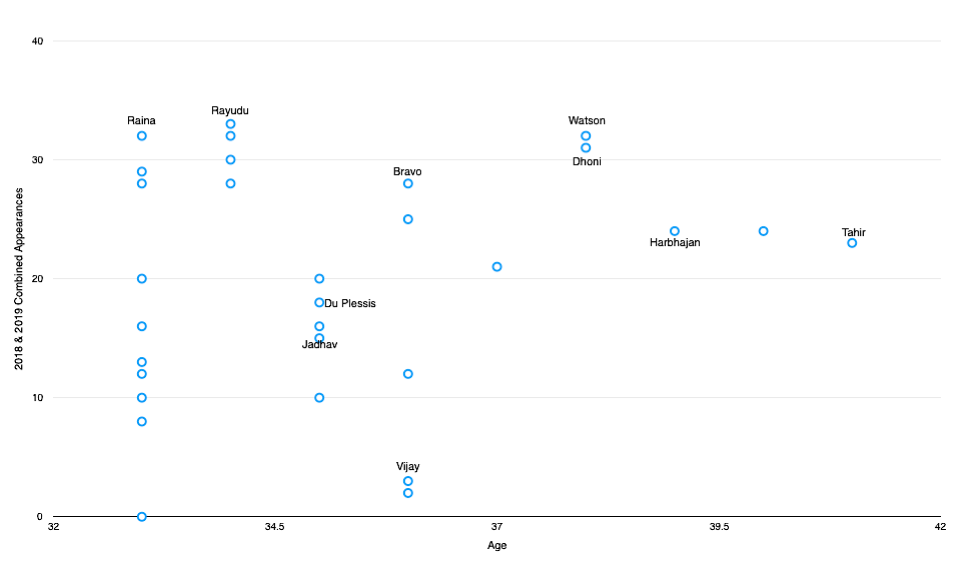
The chart above, looking at players aged 33 or greater in the Indian Premier League also highlights Chennai Super Kings relative dominance of players in this age bracket at the current time. However, you will be able to see that the majority of their players in this age bracket have high appearance totals in the tournament across the last two seasons, so they are clearly making the most out of their players experience levels.
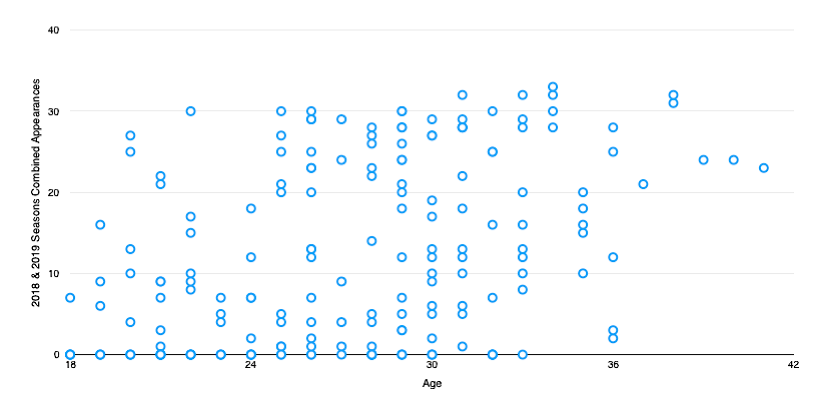
This next chart looks at the age versus appearance dynamic for all current Indian Premier League players (it should be noted that if there are multiple players with the same data, it is indicated by just one dot). Here we can also see that players aged towards their mid-30s or greater are generally utilised to some extent by their teams, with few players featuring in the bottom-right hand corner. However, there’s closer groupings in the bottom- left hand corner, which indicates low game time for younger players - out of the players aged 24 or below, the majority have played 10 matches or fewer.
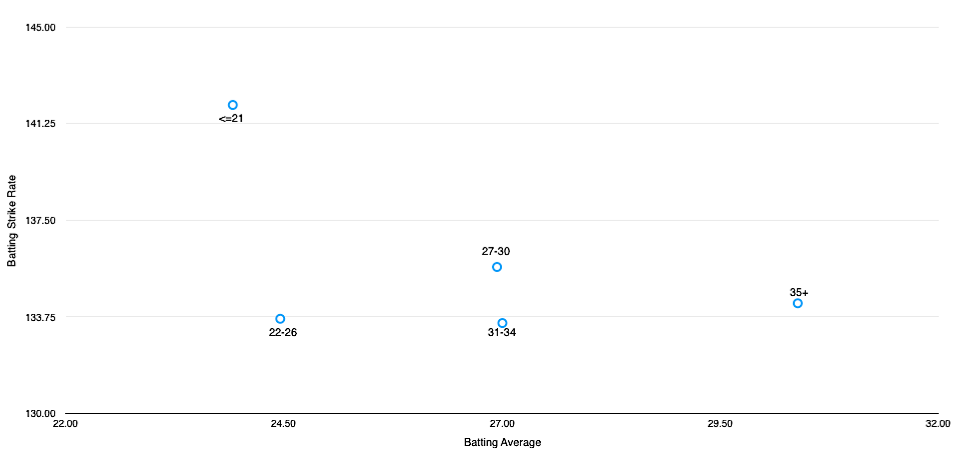
Looking at player data, it’s interesting to see the dynamics of different age brackets (age assessed at the start of each individual Indian Premier League season) across the last three seasons of the Indian Premier League. Firstly focusing on batting, a basic batting average versus strike rate comparison starts us off:-
It looks like the exuberance of youth is demonstrated here, with players aged 21 or below featuring in the top-left hand corner of this graph (low batting average, high strike rate) and this perhaps gives a glimpse of how the future might play out - this grouping of young players don’t appear to value wicket preservation nearly as much as older players, while also looking to score quickly, and while scoring rates have generally risen in T20 leagues across recent years, it would be foolhardy to think that they won’t rise further. With young players having such a dynamic, as they get more game time, it would appear reasonable to think that scoring rates will rise to even greater levels.
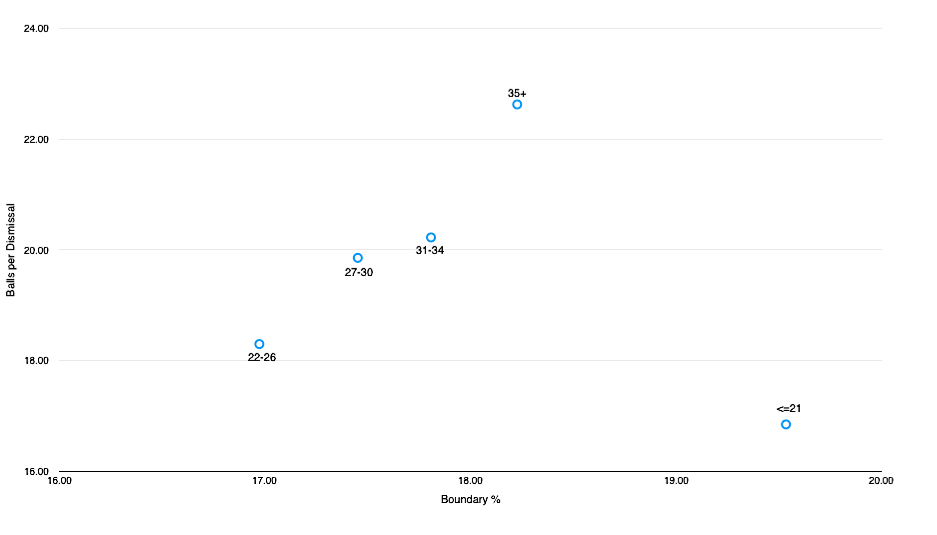
Generally younger players, including the 22-26 age bracket, would appear to offer less stability than other players, as evidenced by them having lower batting averages. This is also evidenced by the chart below which looks at boundary percentages versus balls per dismissal for the various age brackets:-
We already know that strike rate is hugely driven by boundary hitting and given that players aged 21 or below have the highest strike rate, it’s not surprising to see them also having the highest boundary percentage. However, both this age bracket and also the 22-26 age grouping have the lowest balls per dismissal figures, so indeed, these younger players offer less stability. In fact, balls per dismissal figures rise in line with age brackets, which perhaps shows a different mindset for the various age brackets with regards to wicket preservation versus aggressive boundary-hitting.
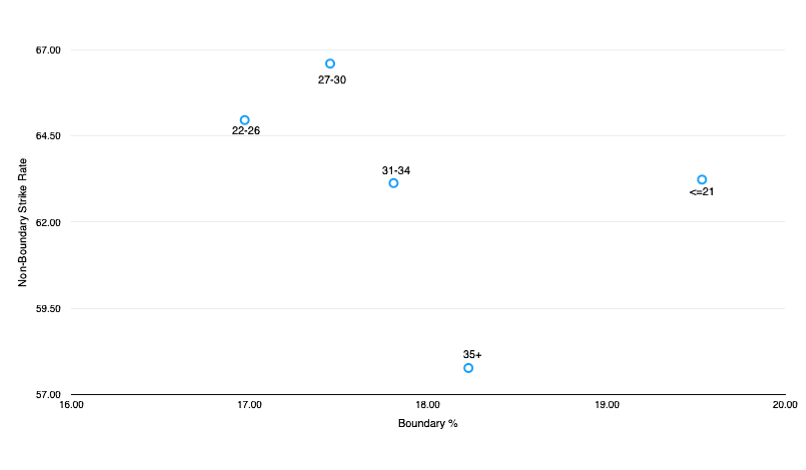
A glimpse at how various age brackets score their runs is also useful. We have seen the boundary dynamics, but what about their ability to rotate the strike? The chart below compares the boundary percentage versus non-boundary strike-rates for each age grouping:-
The biggest take-away from this chart was the marked drop in non-boundary strike rates for players aged 35 or more. This age group, in general, look like being below-average rotators of strike and have a higher percentage of their overall strike rate driven by boundaries. This approach is fine - we’ve already ascertained that boundary-hitting is a much bigger driver of success than avoiding dot balls - but franchises should be aware that as players age, there could well be the potential for them develop into worse rotators of the strike. For example, if a batsman aged in their low 30s already doesn’t possess above-average boundary percentages, then a potential drop-off in their ability to rotate the strike well could be extremely problematic for their future level.
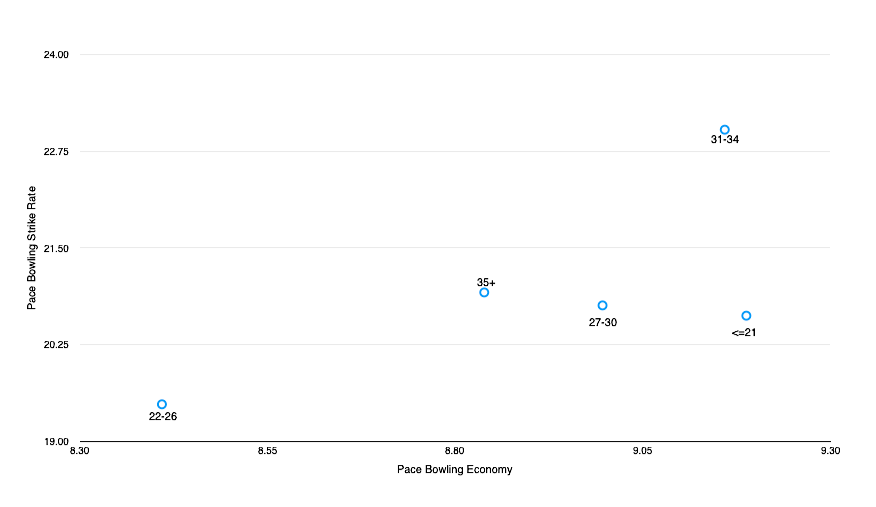
Moving on to bowling, it is interesting to note the split between age groupings when looking at economy rate versus strike rate (balls per dismissal), as can be seen below. For pace bowling, numbers for the age grouping 22-26 were the best by some distance, and it’s worth noting that Indian Premier League teams looked to have grasped this quite well, with these players bowling more pace overs than the other age brackets - this wasn’t replicated when looking at spin figures.
The difference between age groups 31-34 and 35+ is also fascinating. The age group 31-34 recorded the worst numbers, while 35+ had the second best economy in conjunction with an acceptable strike rate. This begs the obvious question as to whether age-related decline has somehow been reversed, but my explanation, having looked at player data intensively, is more simple - the bowlers in this sample having still played when aged 35+ are often previously elite players, such as Mitchell Johnson, Dwayne Bravo, Dale Steyn and Lasith Malinga, while there’s a more wider ability differential for players aged 31-34. It looks like many pace bowlers aged in their early 30s are eventually jettisoned by franchises as they reach their mid 30s, and to a large extent, only the previously elite pace bowlers survive after this point.
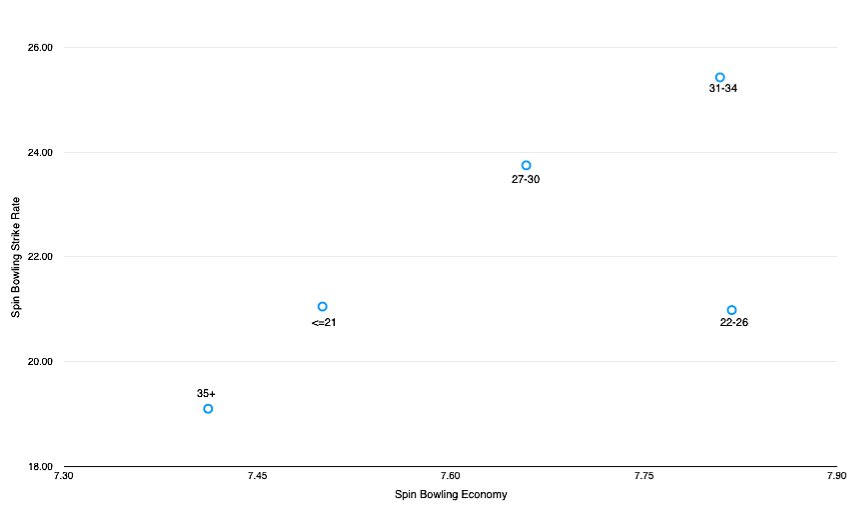
This was also the case for spinners as well, as the chart below indicates. The spinners aged 35+ have also often had elite careers, such as Harbhajan Singh, Imran Tahir and Amit Mishra, while there was again, potentially, a wider ability differential among players aged 31-34. We see again the mediocre general performance of bowlers aged 31-34, this time among spinners, as well as noting that very young spinners, those aged 21 or below, performed very well. Players in this age bracket include the likes of Rahul Chahar, Washington Sundar, Sandeep Lamichhane, Mujeeb Ur Rahman and Rashid Khan, and all these players have produced strong levels in recent years in T20 cricket.
Looking at pace and spin combined, it is evident that the extremes of the age brackets performed well, while age 31-34 was the worst age grouping by a reasonable distance. There could potentially be several take-aways from the charts in this chapter. Firstly, when looking at young players - those aged 21 or below - bowlers could be a better investment than batsmen, who tend to offer boundary-hitting but a weak stability at a young age. In addition, batsmen tend to be able to retain a higher level of performance as they get older than bowlers do, unless the bowlers are generally of a previously elite level.
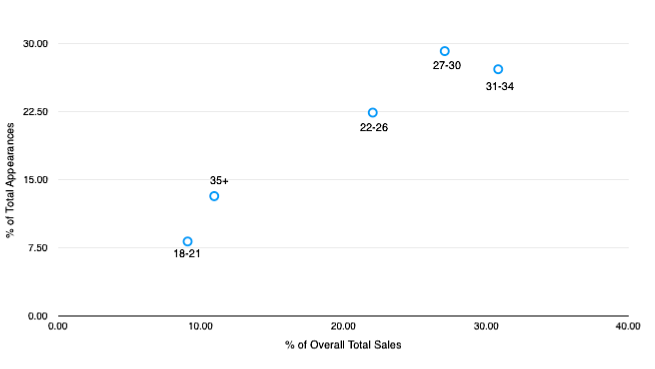
Trying to understand why both pace and spin bowlers struggled when aged 31-34 is certainly worthwhile. Now, I want to introduce a further chart here which looks at the percentage of overall total sale price at auction for each age group (based on age at the time of writing, and each player’s last purchase price) compared to the percentage of total appearances they made in the last two seasons.
An efficient market should have identical percentages for sales and appearances, but this is not the case currently in the Indian Premier League. The main outlier was that 31-34 age bracket, which commanded 31% of sale prices among current players, but these players generated just 27% of appearances. So teams look like they are paying relatively more for this age group compared to their eventual output, and from the chart above, we can also see that this age group commanded a higher percentage of total sale prices than age group 27-30, but had a lower percentage of total appearances.
This analysis potentially indicates that some Indian Premier League franchises are retaining players aged around 30 years of age on high value contracts, and eventually many of these players decline and their output drops, both via the number of appearances they make, as well as their numbers in those appearances. Could there be a decent argument made that a lot of players are retained for one retention too many, often at high cost? The numbers above indicate that this may well be the case.
Retention strategy is extremely difficult. Emotion can be an influence, particularly if the player has been at a franchise for a long period of time and has been a key part of the team, and teams may often prefer to be what they could perceive to be risk-averse - unwilling to risk losing a player around 30 years of age to a rival - even though that strategy may actually be a riskier strategy than releasing that player, given the potential for decline, particularly for bowlers, as a player ages into their 30s.
However, rational decision-making rarely factors in any emotion whatsoever. In an efficient market, teams don’t just need to consider the likely current level of a player, but also their expected level in the future, and whether this represents value for money. A conveyor-belt like approach where players are continually recruited at a fairly young age and then continually either released, or retained at a lower cost when players reach peak age, looks like being a very viable strategy.
