Season net boundary % in T20 leagues
Further evidence to suggest the value of this metric
Something which has been a recurring theme on my Substack and Twitter is the discussion on net boundary percentage as a key metric to decide the outcome of T20 matches. With around 85% of T20 matches won by the team who has the highest boundary percentage in matches (far higher than the comparable dot ball winner metric), it is my genuine belief that this is cricket’s equivalent of basketball’s ‘three-point moment’. Teams, however, are generally still fairly slow to understand this.
For this article I want to go a step further by moving on from individual matches, and look at how net boundary percentage drives success over a league season. From this we will be able to ascertain the most successful teams in their respective leagues in recent years, and also obtain some key targets for teams to achieve in an individual season such as benchmark qualification figures for this metric. Furthermore, we can also look at who the potentially luckiest or unluckiest teams were across T20 leagues in recent years.
For all of the below analysis, I looked at the last two completed seasons (where relevant - not for the new events SA20 or ILT20 which have just one season of data) for the following leagues: IPL, PSL, Hundred, BBL, CPL, SA20, ILT20.
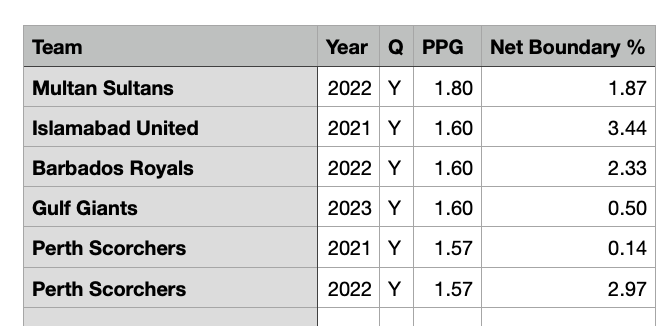
First up, the top points per game teams in a season:-
These were the six teams with greater than 1.50 points per game in their T20 league season in this sample. Four teams (the exceptions were Gulf Giants in 2023 and Perth Scorchers in 2021) had huge net boundary percentages across their season.
Conversely, the reverse applied for teams with below 0.50 points per game in their T20 league season:-
Only Karachi Kings of these low PPG teams had a net boundary percentage better than -1%, with some of these teams having horrendous negative net boundary percentages overall, far worse than -2%.
Interestingly, the 3/8 qualifying team nature of The Hundred was illustrated here, with my Birmingham Phoenix team in 2022 (1.25 Points Per Game) being the team with the highest PPG in the sample not to qualify. The next lowest across any league in this sample was Oval Invincibles (2021, 1.13), and every team in this sample in a league which wasn’t The Hundred qualified with over one point per game.
The top five net boundary percentage teams all qualified, shown below:-
Phoenix in 2021 recorded the highest net boundary percentage of all teams in these major T20 leagues in their last two seasons. Oval Invincibles were again the unfortunate team to buck the trend. Overall, 11 of the top 12 net boundary percentage teams qualified, while 24/31 teams (77%) with a net boundary percentage in excess of 1% qualified for the knockout stages of their relevant league.
On the flip side, the 16 teams with the worst net boundary percentage failed to qualify, and only four teams with a net boundary percentage worse than -1% qualified. Paarl Royals (-1.44%) in the recent SA20 were the team with the worst net boundary percentage but qualified - a consequence of 4/6 teams qualifying from that relevant league, perhaps.
A look at the relationship between points per game and net boundary percentage in tournaments is fascinating:-
Keep reading with a 7-day free trial
Subscribe to Dan’s Newsletter to keep reading this post and get 7 days of free access to the full post archives.


