False Shots & Expected Wickets in the IPL
Which teams and players have been lucky or unlucky?
In football, the concept of expected goals is now very mainstream. However, it’s far from mainstream in cricket and I’ve yet to, for example, read any content surrounding expected wickets.
Before we get started, anyone interested in discussing how I can help their team with strategic management and data-driven analysis can get in touch at sportsanalyticsadvantage@gmail.com.
The concept of expected wickets and false shot percentages is something I’ve been working on over the last couple of years and refined it with some coaches in the summer, which proved very useful. Understanding, quantifiably, with average luck, whether a team is lucky or unlucky, or whether a player should have been dismissed more or less often or taken a different amount of wickets is incredibly useful when it comes to reacting to performances.
For example, if a team loses by a considerable margin in matches it is easy for management to have a knee-jerk reaction to that loss and make team changes for the next match. But what if a strategist can prove to the coaches that actually their team were unlucky in the match and actually deserved to win, or at least lose by a smaller margin? Often times, the team selected for a loss is probably the best team to be selected for the next match, and understanding and quantifying the luck element in an individual match can be of real benefit to a management group.
I’ll give two matches as examples.
Match 1: Leicestershire v Durham (T20 Blast, 2022)
I was working for Leicestershire at the time, who suffered a 54 run defeat. It was the opening match of the season so it would have been easy for coach Paul Nixon to make a lot of changes to the team moving forward.
However, during the match and post-match we consulted data which showed that actually the performance was ok - Durham had a lot of uncontrolled aerial shots (particularly Ashton Turner, who scored 32 from 18 balls) which flew away for boundaries or ended up in gaps between the ring fielders and the boundary while Leicestershire’s mostly went straight to Durham fielders. My analysis suggested Leicestershire should have lost by about 10 runs instead of 54 runs.
Subsequently Leicestershire kept the same starting XI structure and won eight out of their remaining 13 T20 matches - a great achievement for a county with one of the lowest budgets in the country.
Match 2: Oval Invincibles v Birmingham Phoenix (The Hundred, 2024)
Again, the first match of a season. My team Phoenix got rolled for 89 all out with Oval chasing down our score in 67 balls to win by eight wickets.
However, I communicated that Phoenix actually had a considerably lower false shot percentage with the bat than Invincibles did, suggesting that we were dismissed regularly from false shots while they rode their luck.
Again, without making knee-jerk changes, Phoenix ended up winning six of their remaining seven group matches.
These concepts of false shots and uncontrolled aerial shots are good examples of understanding the variance and volatility involved in T20 matches. Just as there is with winning the boundary count and winning matches, there is a strong correlation between winning the false shot percentage count in matches and winning matches.
It’s not a given - nothing is in sport - but if a team can keep themselves on the right side of these metrics more often than not, it should eventually lead to very positive long-term results.
We can see over seasons, or multiple seasons, whether teams get lucky or not. For example, for this piece I’ve looked at the last two years of the IPL and established the regularity which false shots generate wickets.
For IPL batters, a wicket is lost every 4.92 false shots played. For pacers, they take a wicket every 5.495 false shots played, and spinners do so every 4.705 false shots played. Essentially, spinners need to induce less false shots to pick up a wicket, but their false shot percentage induced is slightly lower than that induced by pacers - slightly related to the match phases in which pacers and spinners tend to operate.
It’s fair to point out at this stage that all false shots are not equal, but this should give a very accurate guide as to where teams and players are at.
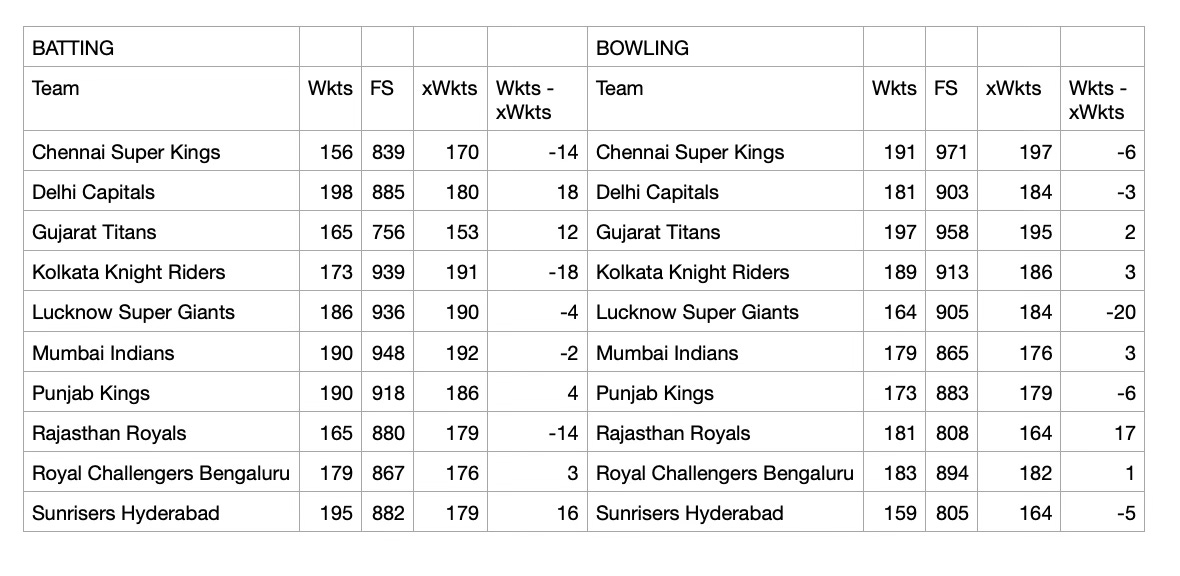
This leads to some interesting assessments of teams over these last two IPL seasons, shown below & split across batting and bowling:
So, just to clarify via an example - this false shot analysis shows that CSK lost 156 wickets with the bat when they should have lost 170 with average luck based on the number of false shots induced by opposition bowlers against their batters. On the flip side, LSG were unlucky with the ball - they took 164 wickets despite their expected wickets figure being 184.
These batting and bowling figures combine to create an expected wickets differential. So, for example, we know that LSG were -20 on bowling wickets but they lost four fewer batting wickets than would be expected which gives them an xW differential of 16, ranking them third in the chart below.
We can see that DC, SRH and LSG were the most unlucky teams over the last two years of the IPL, while KKR and RR were the most fortunate.
Teams with an XW differential of a negative figure (e.g. they were lucky based on false shot data) who had a bad record in the tournament as well might be more inclined to press the reset button ahead of the upcoming mega auction, while teams who underperformed slightly but were very unlucky, such as DC, might decide to stick more with what they’ve got, at least when it comes to retaining key players.
What about players? This type of analysis is critical ahead of a mega auction when it comes to determining future expected performance levels for players and calculating their market value.
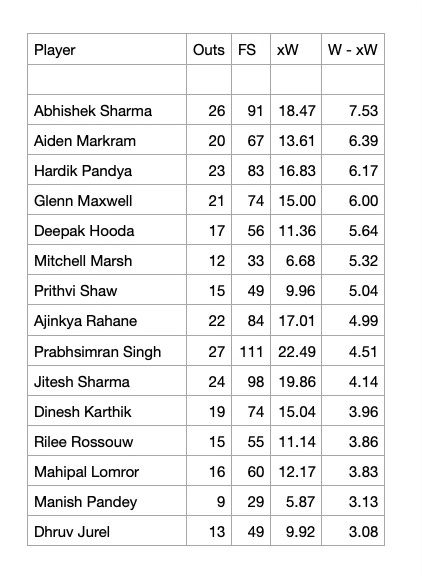
Here are the batters with the biggest wickets - xWickets differentials across the last two IPL seasons (e.g. they have potentially been unlucky and lost more wickets than their false shot percentage dictates):
Again, this reinforces the points I wrote yesterday about Abhishek Sharma having such a high ceiling. Not only has he been outstanding in the last couple of seasons but he has also been super unlucky based on his false shot data.
Also highlighted are several other players who featured well in yesterday’s content discussing intent levels in the tournament, who could well be considered ‘distressed assets’ ahead of the auction - I’m thinking Prithvi Shaw, Prabhsimran Singh and Jitesh Sharma - who all showed potential to upscale or exploit their ultra-attacking shots and have proven to be unlucky based on false shot data. All three probably are nowhere near their peak in terms of market value and could be astute purchases at mega auction, particularly the younger player of the three, Prabhsimran.
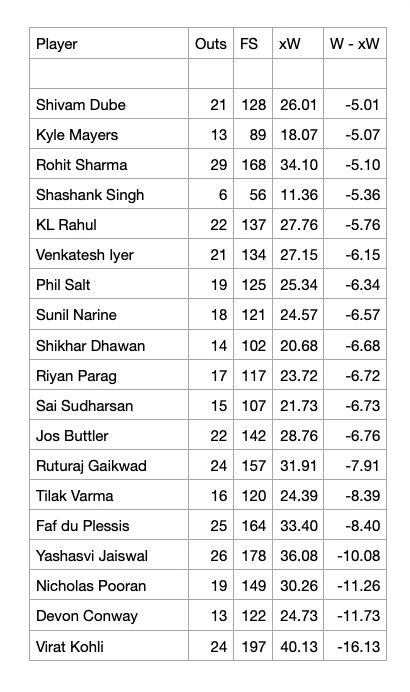
Conversely, here are players who outperformed their false shot data e.g. they have potentially been lucky and lost fewer wickets than their false shot percentage dictates):
Certainly, I’d be cautious about picking up veteran players in this list above, or overpaying too much for many of those batters at the bottom of the list - mean reversion could well come into effect in the short-medium term.
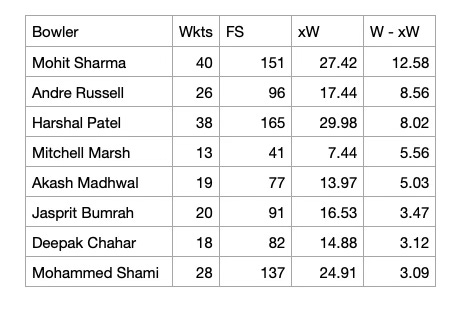
Let’s move onto pacers. Eight bowlers took 3+ wickets more than their false shot percentage induced indicated would be average:-
Mohit Sharma is such an interesting case here. One of the leading wicket takers across the last two seasons, he might pick up a decent level of interest at auction (high quality domestic pacers are still quite a scarce resource) but the false shot analysis I have created suggests he took 12.58 wickets more than he should have. Andre Russell and Harshal Patel could also have the potential to be overvalued by the market (even via the retention mechanism).
Seven spinners took 3+ wickets more than their false shot percentage induced indicated would be average:-
Again, I’d be cautious about anticipating actual performances from veteran players on this list continuing.
A list of undervalued bowlers might be a little more sensitive and extremely beneficial to teams, but there are ten bowlers (5 pacers, 5 spinners) who took at least five wickets fewer than would be expected than their false shot percentage indicates would be average luck. The most unlucky pacer took 7.41 wickets fewer than they should have done, while the most unlucky spinner took 9.15 wickets fewer and I’d definitely be looking to sign that bowler if I had the opportunity.
Anyone interested in discussing how I can help their team with strategic management and data-driven analysis, or contribute to any media work, can get in touch at sportsanalyticsadvantage@gmail.com.
Raw data sourced from Kadamba/Cricket 21.


