Big Bash 2022/23 Season Basic Group Analysis
How did each team perform?
The Big Bash has now reached the end of the group stage, so ahead of the long knockout stages I thought it might be interesting to have a good look at the performances of each team throughout the group stages. Please note that this is basic analysis and I can offer much more to teams worldwide, but I have to keep some areas of analysis for their benefit.
I’ve watched a fair bit of the BBL this year and to be honest, it’s been pretty uninspiring viewing. Two teams - Perth Scorchers and Sydney Sixers - were so far ahead of the rest in the table (although Perth in particular excelled), overseas players often haven't been replaced and some domestic players clearly aren’t at the requisite standard for a high level T20 league.
Before I get into the analysis, it’s easy to envisage how the standard and watchability of this league could improve.
Four overseas (higher standard from the start and in particular so we see less of the often mediocre domestic players coming in halfway through the competition) available throughout - this will need higher recruitment budgets but given the other leagues around at the time, is mandatory.
An uncomfortable conversation needs to be had around full availability of Australia’s international players too - because all top leagues have full availability of domestic stars.
Bring the boundaries in, because most people don’t want to see 120 v 120, they want to see boundaries.
I also was really disappointed to see the end of the Bash Boost point in particular after last season, because teams were so inept tactically around it, often failing to grasp that it represented 1/4 of available points in the match. With 5/8 teams qualifying, a team could go 5-9 but pick up 8+ bonus points and have a decent chance of qualification by being smart.
Reduce number of teams qualifying. 4/8 is more than reasonable. It’s difficult not to think that with 5 teams qualifying and the 5th team (and maybe the 4th) having a non-positive win-loss record, such a structure rewards failure. While 3/8 in The Hundred is too extreme in my view, and can punish teams with good records (a team winning 60%+ of their matches should always qualify in a T20 league), 4/8 is a fair mid-point.
The group stage net boundary count illustrates the above point:-
We can see from above that Perth Scorchers were simply head and shoulders above every other team in the group stage - top of boundary hitting and second for boundary prevention. That will do it for any team!
Conversely, five teams had a negative net boundary percentage, with Brisbane Heat having the worst net boundary percentage yet still sneaking into the qualification spots in 5th place - illustrating the point about rewarding failure. Hobart Hurricanes were arguably unlucky not to qualify, which might console them slightly after their 6th placed finish which represented an extremely disappointing season considering the quality of their squad.
The low boundary-hitting numbers for teams is also worth discussing briefly. Only two teams hit over 16%, a figure which is still below league averages for competitions such as the IPL and T20 Blast, with Melbourne Stars in particular struggling badly at boundary-hitting. It’s not going to be easy for any team to qualify hitting barely above 13% boundaries, but the good news for them is that it’s a pretty easy problem to fix if they nail their recruitment, which is an area where they’ve struggled badly in recent years. I’m pretty sure I could help them considerably to turn their fortunes around if they were willing to take a different approach to the last few seasons.
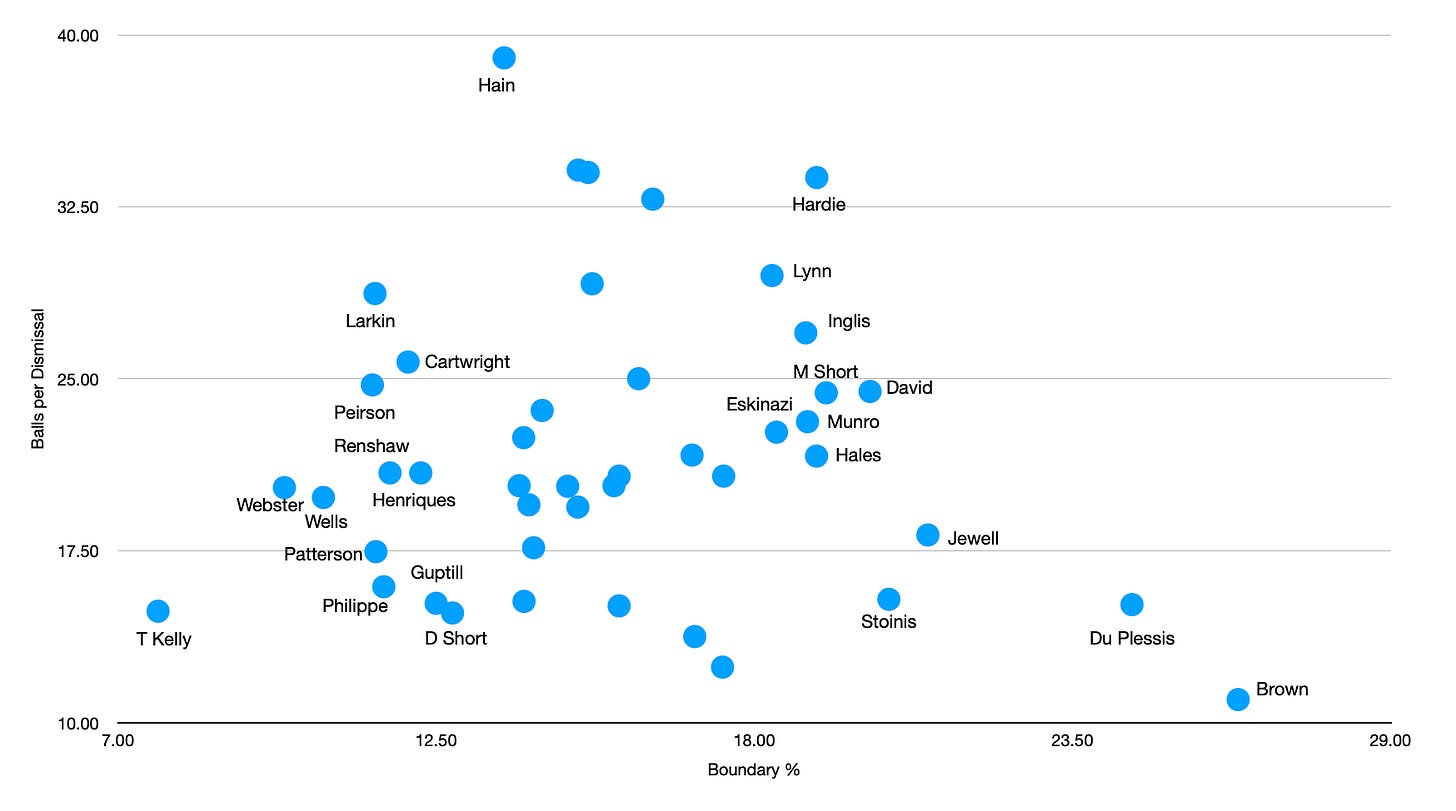
There are below-boundary hitters in all leagues - that’s how average figures work - but some of the figures for BBL batters are, to not put too fine a point on it, disastrous. With some of the same names having similar data year on year, there is either a lack of domestic batting talent in the league, or a real problem with talent ID and recruitment. The fact that Josh Brown had the highest boundary percentage of any player facing 100+ balls in the tournament but started the year playing grade cricket and made his debut in the BBL several weeks before turning 29 years of age illustrates that it may well be the latter explanation. Surely there must be batters at a lower level who can hit better than some of those players in the bottom-left corner who struggle with boundary-hitting year on year?
Please note that Steve Smith does not feature in this chart due to skewing the balls per dismissal axis.
The question surrounding talent ID and recruitment comes to the fore again when looking at Stevie Eskinazi at table-topping Perth Scorchers. His BBL numbers, as they are in England, turned out to be very solid indeed yet he started the season out of the starting XI with Perth choosing to field less than their full quota of overseas players, and batters considerably less proven than the Middlesex man. It’s just bizarre to recruit an overseas player and not play them from the start, and I can tell you right now that any half-decent expected performance model would have made him an obvious starter for Scorchers ahead of some domestic batters and in a low-scoring league such as the Big Bash, he would be an excellent ‘Moneyball’ type pick.
Moving back to team analysis, here’s a chart showing each team’s strike rate versus pace and spin:-
The two teams at the top of the table were closest to the ideal top-right corner, and given that Sixers’ boundary-hitting wasn’t near the top, it can be assumed that their non-boundary run production was at a very high level indeed.
Heat and Stars really struggled with hitting spin with much intent, and Stars struggled further with the trade-off between intent and stability. A strike rate just over 106 against spin in conjunction with 28.42 balls per dismissal against opposition spinners shows they simply didn’t take enough risks to impose themselves against spin from rival teams. Indeed, their BPD against spin was the highest of all eight teams, but this data is suboptimal - something like 125SR/22BPD against spin would be much better.
Conversely, Thunder in particular had issues facing pace, with the lowest strike rate against opposition pacers by a decent distance. Renegades hardly covered themselves in glory in this area either.
Phase performance is useful to assess also, particularly up front and at the death. Here’s a look at overs 1-4 basic performance levels for each team:-
It might shock readers to see that no BBL team hit at over 130 in the Powerplay. With the field restrictions, this is the optimal time to attack and yet as you can see, teams were largely reticent to do so. Three teams in the bottom-left hand corner - Strikers, Thunder and Renegades - need to dramatically improve their Powerplay performance, because these numbers aren’t pretty at all. Bottom of the table Stars actually performed best batting in the Powerplay, so it’s worth noting how they perform in other phases…
Onto that - here’s the same analysis for overs 5-16 (middle overs):-
The top two teams in the table performed best in this phase, with Scorchers off the charts. Hurricanes showed a big issue with dismissal rates in the middle overs, which was a factor in their failure to qualify and the recruitment of Asif Ali, who has a very low balls per dismissal count in recent years and eventually didn’t end up playing the full season, probably didn’t help in this area.
The two Melbourne teams struggled the most with their strike rate, with Stars the worst by a long way - going from Powerplay hero to middle overs zero. To re-iterate, this problem should be solvable with smart recruitment.
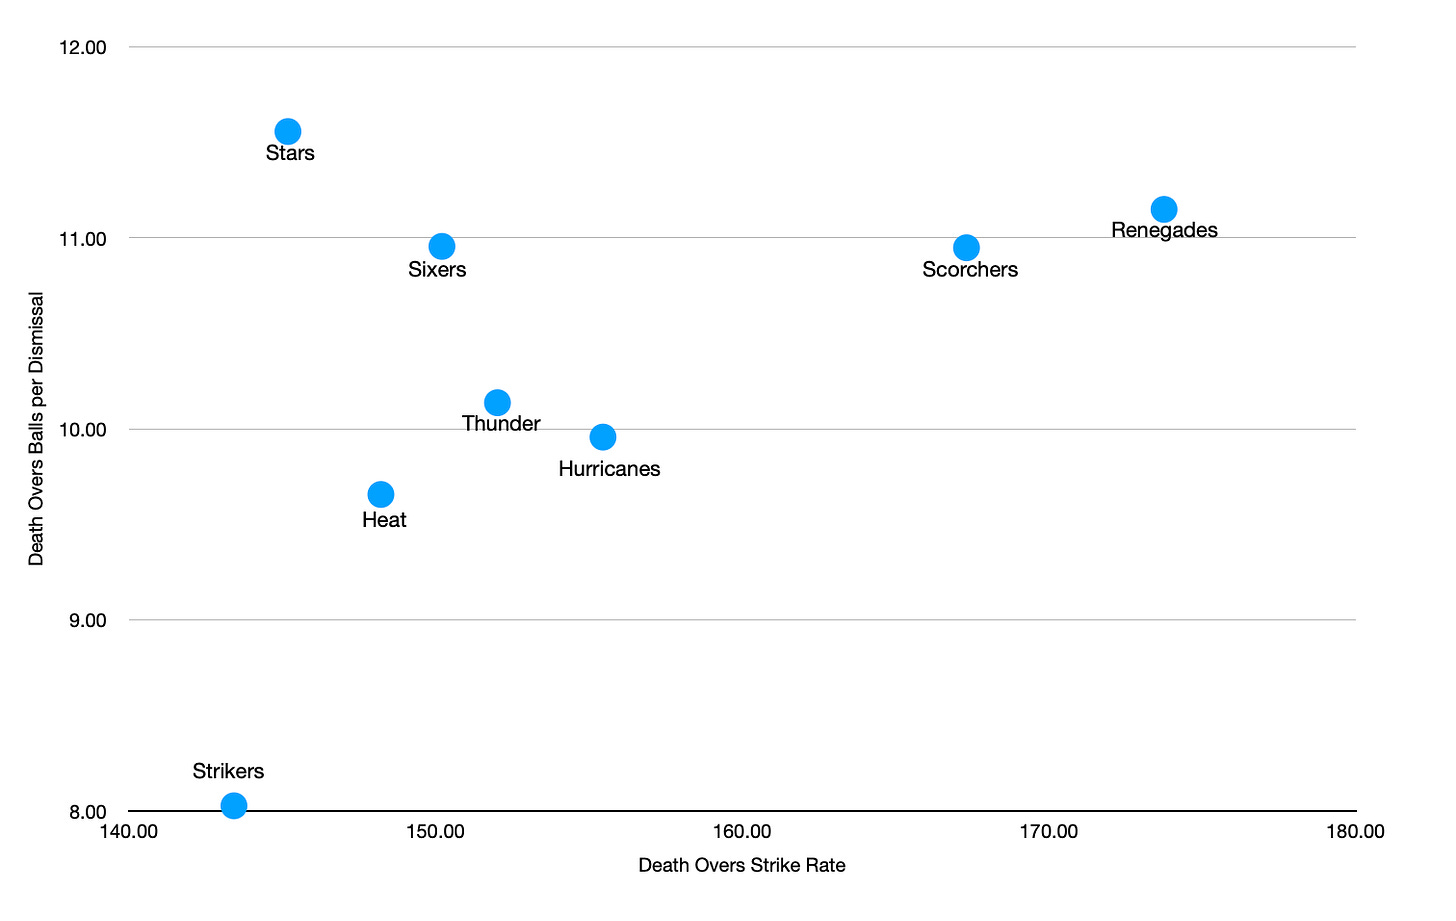
They also had an issue in the death overs (17-20):-
Again we go back to that trade-off between intent (strike rate) and wicket preservation (balls per dismissal). There’s no need to have such a high BPD count here with such a low strike rate - something like 160/10 would be much better than 145/12. These trade-offs are all about shot options taken, and a willingness to fail in order to succeed.
Struggling even more at the death were Strikers, who had a curious batting group containing some high intent batters (Short, Lynn, Hose and De Grandhomme) and others who, being blunt, have shown difficulty towards contributing positively to win the boundary percentage count in matches.
Having had a look at some basic batting data, it’s now time to move on to some basic bowling analysis.
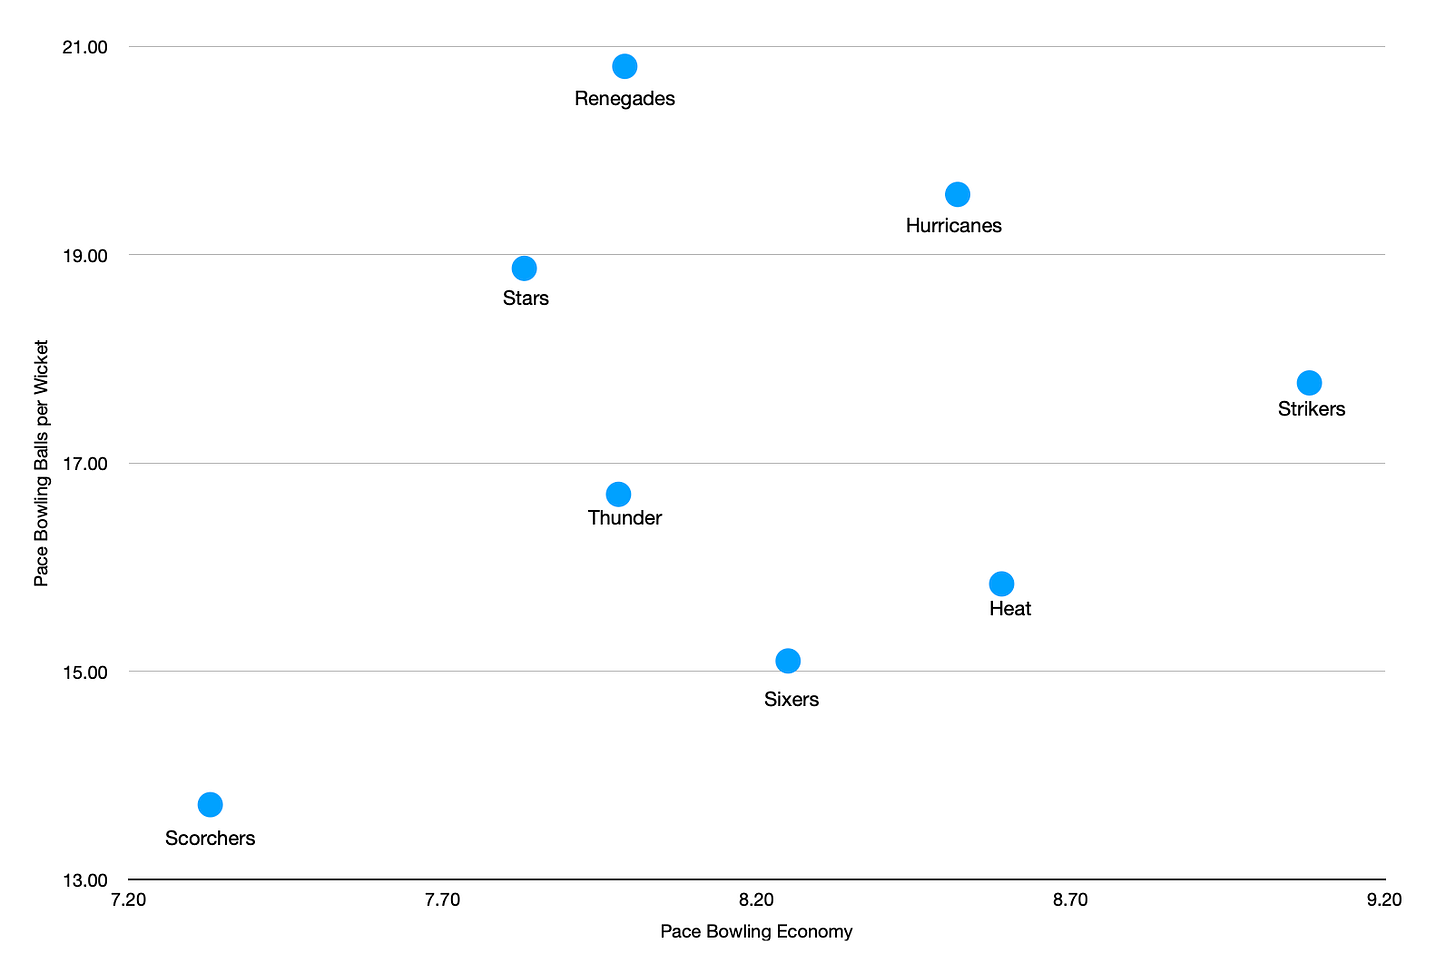
Starting off, here’s a look at each team’s pace bowling economy versus balls per wicket:-
As has been the case over many years, Perth Scorchers pace bowling impressed, and this year was no different, being situated in the ideal bottom-left corner (low economy, low balls per wicket).
Interestingly, bottom-placed Melbourne Stars had the second best pace economy - further to our discussion of their batting, it seems evident that we can firmly push the blame for their finish towards their batting group as opposed to their bowling group, which didn’t perform badly in general.
Conversely, Adelaide Strikers and Hobart Hurricanes pace bowling groups struggled badly. In particular, Strikers look like they need to recruit to reinforce their pace attack.
Now, the same analysis for spinners:-
The spin trio of O’Keefe, Murphy and Naveed contributed strongly to Sixers outclassing the field with their spin bowling numbers. Again, Stars bowling was decent, further suggesting their 3-11 record was largely due to their batting underperformance.
Despite a superb full debut season from Paddy Dooley, Hobart Hurricanes struggled with spin economy, while the defensive nature of Scorchers off spinners (Agar/Turner) is shown by their high balls per wicket figures. Heat had very poor spin numbers and could be well advised to look to recruitment to fix this problem.
With most BBL teams (and obviously, players) struggling to strike well against spin, having a high quality spin attack looks to be a must-have when constructing a list. If you can create a spin group who can be very flexible with match-ups and ideally have all three main spin types in your starting XI (with the off-spinner being a match-up option only, coming from the batting group because of match-up difficulties given that around 75% of batters are right-handed) then it looks to be extremely beneficial.
Now to have a look at individual bowlers - first up, spinners bowling 100+ balls in the group stages (Swepson who had a 51.60 balls per wicket figure is not included due to skewing the balls per dismissal axis):-
The veteran Steve O’Keefe has been the best spinner in the group stages by quite some distance. Emerging spinners Murphy and Dooley also impressed, situated close to the ideal bottom-left of the chart.
The same now, for pacers:-
With J Richardson, Kelly, Tye and Behrendorff all towards the bottom-left corner, Perth Scorchers pace bowling groups strength is unsurprising and went a long way to helping them top the group stage. Conversely, with Thornton, Conway and Agar all in the Strikers group and being towards the less ideal right-hand side for boundary concession, it’s not a surprise that Strikers struggled with pace economy. Throw in a very mixed ability batting group and their failure to qualify wasn’t a huge shock - but again, is an issue which would be easy to resolve with smart recruitment and being ruthless with retentions.
Now, on to team performance across phases. First of all, the mandatory Powerplay (overs 1-4):-
With top two teams Scorchers and Sixers in the ideal bottom-left corner, the value of early Powerplay wickets is evident here. Conversely, Renegades struggled to make an impact up front with the ball, and Strikers worse than average boundary concession was illustrated here with the second-worst economy rate - even though they took wickets at a decent rate.
Same analysis now, but for the middle overs:-
Again, Scorchers smashed it - they have an obviously strong foundation of a high quality bowling attack and they don’t even need to be outstanding batters/hitters when their bowling attack is this good. On the other hand, Heat/Strikers/Hurricanes struggled with the ball, which they also did in overs 1-4 as well. Quite simply, they need to consider whether they have to recruit better.
Finally, the death overs:-
It’s Scorchers and Sixers again who impress here, situated in the ideal bottom-left corner. Also again, the boundary concession issues from Hurricanes, Heat and in particular, Strikers are highlighted here, and these must be addressed if they are to improve in the future.
I hope you enjoyed the read, and found it useful ahead of the knockout stages. I’ll end with a shameless plug: if you are working with a BBL team (or any T20 franchise team) please feel free to drop me an email at sportsanalyticsadvantage@gmail.com and we can discuss how the data and analysis work I supply to teams can be of assistance to you.


